Ever wondered just how safe your car really is? The NHTSA star ratings break down crash tests into a straightforward report card you can rely on. They run tests for front impacts, side collisions, and even check the roof strength, so you get a real sense of how a car behaves in the real world. In this post, you'll find out what each test involves and how those scores boost your protection on the road. Hang around to see how these ratings spotlight safety and help you make a smart choice when picking your next ride.
nhtsa vehicle safety ratings Shine with Accuracy
NHTSA’s New Car Assessment Program gives each vehicle a rating from 1 to 5 stars, focusing on three big areas: frontal crash, side crash, and rollover resistance. They run tests in clear steps, imagine hitting a fixed barrier at 35 mph for a frontal crash, using a moving barrier at 38.5 mph and a stiff pole at 20 mph for a side impact, and then checking the roof strength with a 3.0 PSI load, which is a way to measure how much pressure the roof can handle.
These tests show us how a car might behave in a real accident while also measuring the risk of injury to the people inside and the car’s build strength. Think of the star rating like a quick report card: a 5-star rating means the car offers top protection in every test.
Each category adds up to an overall score, with the frontal and side results weighing more than the rollover. This easy-to-read score helps people compare cars using clear, objective data on how well each vehicle might protect them in an unexpected crash.
NHTSA Vehicle Safety Rating Test Procedures and Methodologies
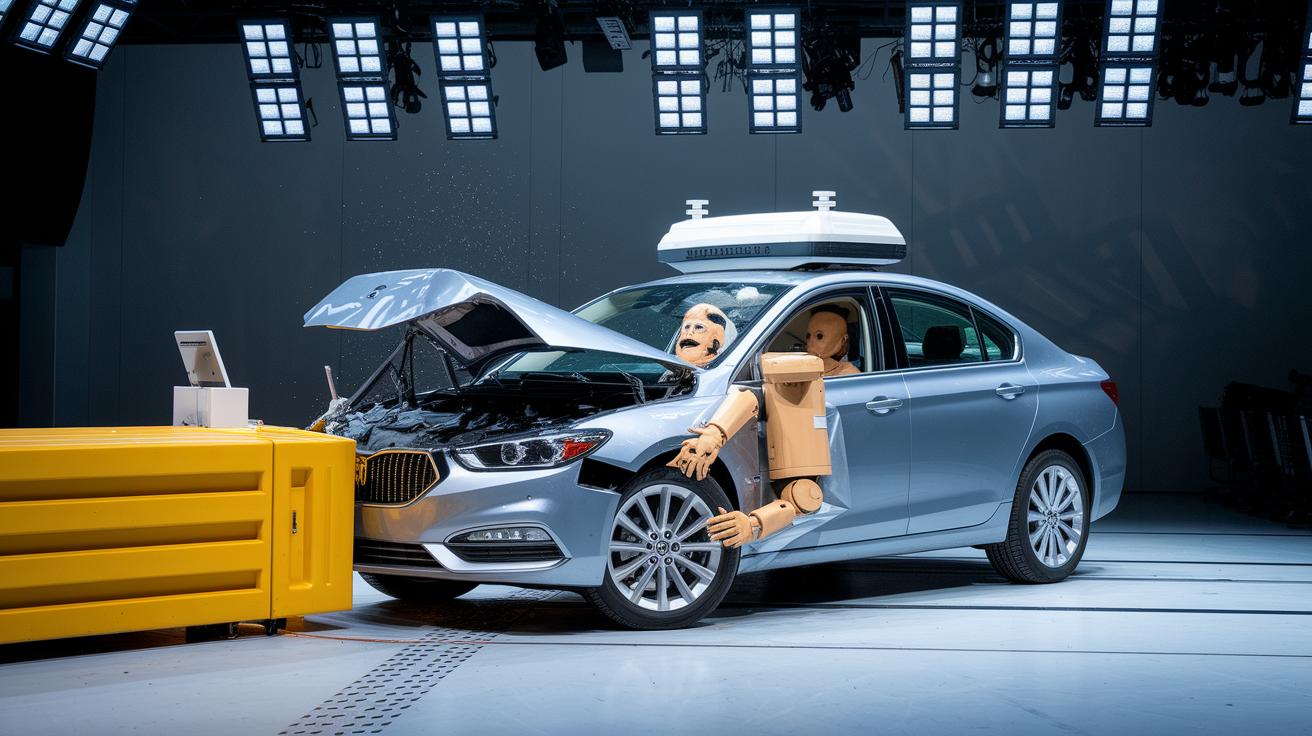
NHTSA runs a set of simple tests to see how cars handle crashes. In the front crash test, they use a male crash dummy representing an average person. It helps measure chest deceleration and how fast the head moves when a car hits a solid barrier at 35 mph. Sensors record every bump, kind of like a car’s secret safety report card.
Side impact tests come in two flavors. One test uses a moving barrier that simulates another car hitting at 38.5 mph to see how the vehicle soaks up the impact. The other test smacks a rigid pole into the car at 20 mph to check for door push-ins and head risks. Both methods rely on sensors that turn raw numbers into easy-to-read performance scores, like tuning an instrument until it sounds just right.
For rollover tests, a force of 3,000 lbf is applied to the roof. This shows how tough the roof is and how it holds up when crush pressure is applied. Even small shifts are picked up by the instruments, painting a clear picture of the car’s strength under stress.
All these tests follow strict FMVSS guidelines with repeatable measurements. This means the techy details come together in a way that’s easy for anyone to understand how each test builds the overall safety rating.
NHTSA Vehicle Safety Rating Categories: Frontal, Side and Rollover Analysis
Frontal crash tests show how a car handles energy when hitting something head-on. They measure how hard a dummy's chest is pushed and the forces on its legs. It’s like the dummy is saying, "I felt every jolt." This gives us a clear idea of how the car’s frame soaks up the impact.
Side impact tests use both a moving barrier and a solid pole to see how the car holds up. They check if the door gets pushed in and if there's a risk for head injuries. The results come out as star ratings that tell you quickly how safe the car is inside. Think of it like a friend stepping in to catch a stray ball, simple yet effective.
Rollover tests measure how strong a car’s roof is compared to its weight. This number, called the Rollover Resistance Index, shows how likely the car is to stay upright when things get rough. It’s a straightforward way to tell if you’re in a safe ride.
How NHTSA Calculates Overall Vehicle Safety Ratings
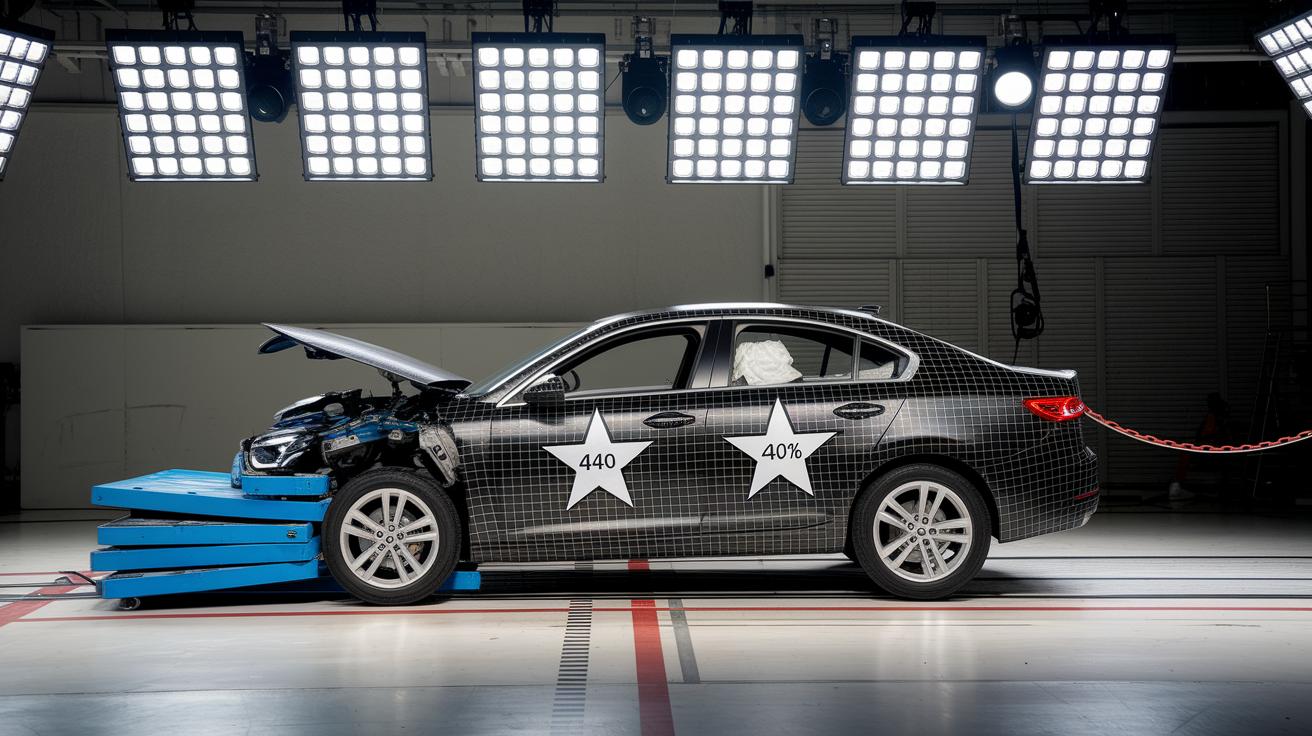
NHTSA uses a pretty simple method to work out a car’s safety score. They mix together the star ratings from different crash tests with an easy-to-follow model. They give 40% weight to the frontal crash test, 40% to the side impact tests, and 20% to the rollover evaluation. Basically, each test shows how likely you are to get hurt, and the scores add up to one overall rating.
This method sticks to federal safety rules and uses injury studies to set clear star thresholds. It’s like turning a bunch of test results into one easy report card. When you see five stars, you know the car offers the best protection.
By simplifying tricky data, this system gives you a clear look at a car’s crash safety. Each test is weighed just right so you can compare cars without drowning in numbers. In short, checking a car’s star rating makes understanding its safety as simple as can be.
Using NHTSA Vehicle Safety Ratings: Interpretation for Consumers
A five-star rating shows a car is built to shield you well in a crash, but it’s not the whole story. When you’re checking out a vehicle, pair that star rating with a hands-on look at key details. Try out the seatbelt reminders, count the airbags, and check that the LATCH anchors (those child seat hooks) are set up right. Think of these as the fine print on your car’s safety report card.
Passive tests like airbag timing help you see how ready the car is to protect you. Picture this: you’re on a wet road and suddenly the airbag pops open at just the right moment. It’s a mix of lab data and that real-life feel that keeps you safe on every drive.
Active systems, such as automatic emergency braking, are listed separately on NHTSA charts. While they don’t get their own star rating, they add useful insights when you compare lab notes with what you notice about the vehicle in real life.
Here’s a quick checklist of what to verify:
| Item |
|---|
| Seatbelt reminders |
| Airbag counts |
| LATCH anchor availability |
| Electronic stability control |
Mixing lab scores with these hands-on checks gives you a clearer picture of a vehicle’s overall safety. That balanced view means your safety scores are backed by real details and solid data. Stay safe out there!
Comparing NHTSA Vehicle Safety Ratings Across Popular Models

When you check out NHTSA ratings, it's like peering at a report card for each car. Recent tests show that midsize sedans usually earn about 4.7 stars, while many compact SUVs score roughly 4.5 stars. These grades come from tough crash tests that see how well a car handles impacts and keeps everyone safe. Independent crash studies back these numbers with real-world data, proving that cars with high ratings really hold up when it counts.
Take the 2023 Honda Accord, for example. It scores a perfect 5 stars in both frontal and side tests, though its rollover rating is a bit lower at 4 stars. Meanwhile, the 2023 Subaru Outback impresses with a perfect 5-star rating across all three tests.
Think of it like a sports team giving its best performance every time. This snapshot helps you see which models meet high safety standards and protect you and your loved ones on the road.
| Model | Frontal | Side | Rollover | Overall |
|---|---|---|---|---|
| 2023 Honda Accord | 5 | 5 | 4 | ~4.7 |
| 2023 Subaru Outback | 5 | 5 | 5 | 5 |
This clear summary gives you an easy run-down of each car's crash test scores, making it simple to pick the one that best fits your safety needs.
Final Words
In the action, we've looked at how nhtsa vehicle safety ratings use clear, straightforward tests to inform buyers about crashworthiness. We broke down the star system, test protocols, and category details, showing how these scores help you decide which models offer reliable protection. These insights pair with real-world consumer checks for an informed look at vehicle safety. Enjoy the confidence that comes with clear, dependable car safety data and remember, every test drives us toward a safer road ahead.
FAQ
What are NHTSA vehicle safety ratings?
The NHTSA vehicle safety ratings offer a star-based score that tells you how well a car performed in frontal, side, and rollover crash tests. It gives a quick snapshot of crash protection.
How does NHTSA conduct its crash tests?
The tests include a 35 mph frontal crash, a 38.5 mph side-impact with a moving barrier, and a 3,000-lbf roof crush test for rollover resistance. Dummies and sensors gather data on injury risk.
What do the individual test ratings mean?
The ratings reflect performance in frontal impacts by measuring chest forces, in side impacts by checking door intrusion and head injury potential, and in rollover tests by evaluating roof strength relative to vehicle weight.
How is the overall safety rating calculated?
The overall rating uses a weighted model with 40% for frontal and 40% for side impacts, plus 20% for rollover. This method produces a straightforward star rating for consumers.
How can consumers use these ratings when buying a car?
Consumers can match the star ratings with features like airbag counts and seatbelt reminders to get a full picture of a vehicle’s crash performance, helping them make smart buying decisions.
How do NHTSA ratings vary among popular car models?
Ratings let you compare models by showing differences in crash performance. For example, models such as the 2023 Honda Accord and Subaru Outback score high in most test categories, reflecting top safety standards.